
Does anyone have an idea what the run-off gravity profile looks like for fly sparging? Is it a linear drop? exponential decay?I would tend to think exponential decay, but I wonder if there's some (accessible) data out there.


Run-off Profile
Started by
3rd party JKor
, Jun 12 2009 02:02 PM
21 replies to this topic
#1

3rd party JKor
-

- Patron
-

- 64142 posts
Puller of Meats
- LocationNW of Boston
Posted 12 June 2009 - 02:02 PM
#2
RommelMagic
-

- Members
-
- 454 posts
Advanced Member
- LocationHighland Falls, NY
Posted 12 June 2009 - 05:00 PM
I'm not so sure why it would be important, but I would agree that it is an "exponential decay". Not that there is any decay in my brewery... 
#3
stellarbrew
-

- Members
-
- 682 posts
Advanced Member
- LocationAcworth, GA
Posted 12 June 2009 - 05:25 PM
My guess, based on predictive models of similar runoff systems, is that you could model with it with either an exponential decay function or a hyperbolic decay function. Probably a hyperbolic would be a tighter fit. I would think that the function would be highly dependent on particular system parameters. Your best bet would be to take experimental data points from your system, keeping in mind that your results would probably only be applicable to a similar grain bill size in your particular system. Are you planning to use this to try to predict when your runoff would fall below a predetermined SG, to use as a sparge cut-off point?
#4
MolBasser
-

- Members
-
- 15351 posts
Comptrolled by Seahawks
- LocationChico, CA
Posted 12 June 2009 - 05:28 PM
Hyperbolic.It drops off pretty quickly at the end of the runoff.BrewBasser
#5
Dave McG
-

- Patron
-
- 9613 posts
Frequent Member
- LocationChicago
Posted 12 June 2009 - 05:47 PM
I've thought about testing this with different water/grain ratios to fine tune some things, but I barely have enough time to brew, let alone sparge into Solo cups to take readings along the way. If I were to guess, the first several gallons would be the same gravity because your mash should be fairly homogenous until the sparge water hits. Then, I think it would drop off exponentially from there. If you vorloff, it might change things a bit depending on if you have started the sparge water yet when you pour the runnings back in. Batch sparging should look like stair steps on a graph.Does anyone have an idea what the run-off gravity profile looks like for fly sparging? Is it a linear drop? exponential decay?I would tend to think exponential decay, but I wonder if there's some (accessible) data out there.
#6
MtnBrewer
-

- Moderators
-
- 6695 posts
Skynet Architect
- LocationThe Springs
Posted 13 June 2009 - 08:22 AM
It's flat until most of the original mash liquor has been drained. After that it drops slowly for a while and then faster towards the end.
#7
davelew
-

- Members
-
- 19229 posts
Comptroller of ACMSO That Are Not Beans
- LocationReading, Massachusetts
Posted 13 June 2009 - 05:19 PM
This brings up something I've been thinking about. Is there a way to predict the gravity if the runnings from each batch sparge? Do you need information beyond grainbill, efficiency, dead space, and volumes of the batch sparges?Batch sparging should look like stair steps on a graph.
#8
ncbeerbrewer
-

- Members
-
- 2210 posts
Frequent Member
- LocationRaleigh NC
Posted 14 June 2009 - 06:53 PM
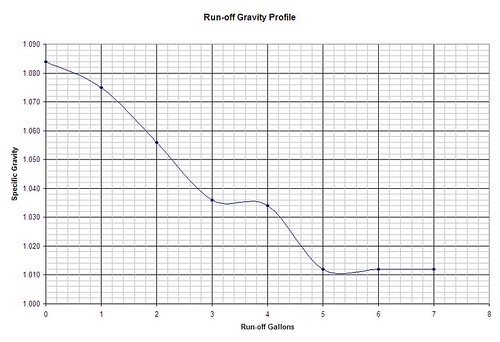
This morning I brewed a Bavarian Hefeweizen and this thread came to mind. I decided to take a gravity check with my refractometer at the very beginning of run off then as I collected each gallon. I collected 7 gallons as I was supposed to collect according to Beersmith. I will toss up the gravities here and let you technical guys dissect it. As a method I am more of a fly sparge guy as I add water as I run off. Run off was over a 30 min timeframe today as well. Mashed 10lbs of grain. 5.5lbs German Wheat, 4.5lbs German Pilsner. Here are the numbersInitial Runoff 1.0841 Gallons 1.0752 Gallons 1.0533 Gallons 1.036 4 Gallons 1.0345 Gallons 1.0126 Gallons 1.0127 Gallons 1.012Beersmith suggested preboil 1.048My measurement 1.044Beersmith suggested SG 1.054My SG 1.050I was hoping for 1.052 but I got sidetracked wife wanted to go to the pool so I could have boiled off a bit more too.
#9
Stout_fan
-

- Patron
-
- 3115 posts
Frequent Member
- LocationKnoxville, TN
Posted 15 June 2009 - 04:34 AM
... it is an "exponential decay". ...
Basser, I can't follow you. We are talking dissolution here, so since you never get it all. I would have guessed the exponential decay would be correct.Man you tapped those aging advanced trig grey cells.Anyway a hyperbola is:Hyperbolic.It drops off pretty quickly at the end of the runoff.BrewBasser
 The tales of the curves approach a straight line asymptotically.That would mean it goes to zero at a predictable point.
#10
3rd party JKor
-
- Patron
-
- 64142 posts
Puller of Meats
- LocationNW of Boston
Posted 15 June 2009 - 07:25 AM
Nice data, nc. I plotted it out and it looks like a very smooth profile except for the '4 Gallon' data point. It almost looks like that data point should be 1.024, instead of 1.034.Here's the plot with the data above:This morning I brewed a Bavarian Hefeweizen and this thread came to mind. I decided to take a gravity check with my refractometer at the very beginning of run off then as I collected each gallon. I collected 7 gallons as I was supposed to collect according to Beersmith. I will toss up the gravities here and let you technical guys dissect it. As a method I am more of a fly sparge guy as I add water as I run off. Run off was over a 30 min timeframe today as well. Mashed 10lbs of grain. 5.5lbs German Wheat, 4.5lbs German Pilsner. Here are the numbersInitial Runoff 1.0841 Gallons 1.0752 Gallons 1.0533 Gallons 1.036 4 Gallons 1.0345 Gallons 1.0126 Gallons 1.0127 Gallons 1.012Beersmith suggested preboil 1.048My measurement 1.044Beersmith suggested SG 1.054My SG 1.050I was hoping for 1.052 but I got sidetracked wife wanted to go to the pool so I could have boiled off a bit more too.
 Here's the plot with the 4 gallon point changed to 1.024:
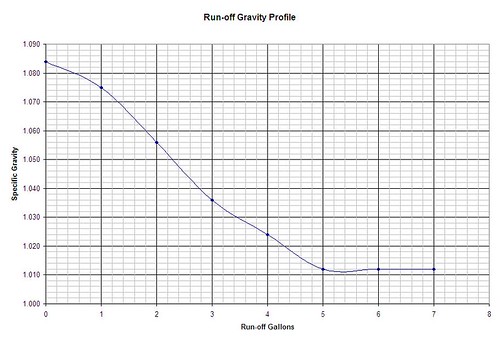 I'm not saying it should be that way. The data is what it is, I just thought that one point looked off.Thanks for taking the time to do this, nc. Cool stuff.
#11
stellarbrew
-
- Members
-
- 682 posts
Advanced Member
- LocationAcworth, GA
Posted 15 June 2009 - 07:58 AM
Actually, a curve which approaches a line asymptotically will never reach that asymptote. If your asymptote is zero, then the curve will get closer and closer to zero the further you extend it outward, without ever reaching zero.Basser, I can't follow you. We are talking dissolution here, so since you never get it all. I would have guessed the exponential decay would be correct.Man you tapped those aging advanced trig grey cells.Anyway a hyperbola is:
#12
ncbeerbrewer
-
- Members
-
- 2210 posts
Frequent Member
- LocationRaleigh NC
Posted 15 June 2009 - 09:33 AM
No Problem JK. I didn't mind doing it at all. I might try and do this again when I brew my next batch probably this weekend. I will look at the charts you posted since here at work the forum stuff gets blocked.
#13
Stout_fan
-
- Patron
-
- 3115 posts
Frequent Member
- LocationKnoxville, TN
Posted 16 June 2009 - 05:05 AM
It approaches a 45° line and crosses the axis at zero value. That is a hyperbola.Presuming an X and Y offset, you would use the lower right leg of the hyperbola.The curve you describe (a zero asymptote) is an exponential decay, hence the discussion.Maaaannn... you guys are giving me BAD flashbacks to some bad math classes.Actually, a curve which approaches a line asymptotically will never reach that asymptote. If your asymptote is zero, then the curve will get closer and closer to zero the further you extend it outward, without ever reaching zero.
#14
stellarbrew
-
- Members
-
- 682 posts
Advanced Member
- LocationAcworth, GA
Posted 16 June 2009 - 05:20 AM
No, it is possible to have a hyperbola with a zero asymptote, and it would be quite a different curve from an exponential decay curve which approaches zero.It approaches a 45° line and crosses the axis at zero value. That is a hyperbola.Presuming an X and Y offset, you would use the lower right leg of the hyperbola.The curve you describe (a zero asymptote) is an exponential decay, hence the discussion.Maaaannn... you guys are giving me BAD flashbacks to some bad math classes.
#15
MolBasser
-
- Members
-
- 15351 posts
Comptrolled by Seahawks
- LocationChico, CA
Posted 16 June 2009 - 05:28 AM
I doubt that it is a real asymtote, but that is the general look. The gravity stays high for a large part of the runnoff then drops off fairly quickly but never really gets to zero (at least in any time frame we are interested in).I'd pull and post the real data, but I'm guessing that would be frowned upon by the company.BrewBasserBasser, I can't follow you. We are talking dissolution here, so since you never get it all. I would have guessed the exponential decay would be correct.Man you tapped those aging advanced trig grey cells.Anyway a hyperbola is:
#16
MolBasser
-
- Members
-
- 15351 posts
Comptrolled by Seahawks
- LocationChico, CA
Posted 16 June 2009 - 05:33 AM
Sort of like this lame drawing. BrewBasser
BrewBasser
#17
3rd party JKor
-
- Patron
-
- 64142 posts
Puller of Meats
- LocationNW of Boston
Posted 16 June 2009 - 07:01 AM
I was looking through one of my books and they had a good plot of run-off profile for a commercial process. I'll see if I can scan it and post it up.It looked a lot like ncbeerbrewer's data, except there was a longer plateau at the beginning of the run-off. Kind of like Basser's pic above, but with another flat section at the end.
Edited by JKoravos, 16 June 2009 - 07:04 AM.
#18
MolBasser
-
- Members
-
- 15351 posts
Comptrolled by Seahawks
- LocationChico, CA
Posted 16 June 2009 - 07:35 AM
Yeah, it will plateau out in the end also depending on how far you take the lauter, sigmoidal like.BrewBasser
#19
3rd party JKor
-
- Patron
-
- 64142 posts
Puller of Meats
- LocationNW of Boston
Posted 16 June 2009 - 04:50 PM
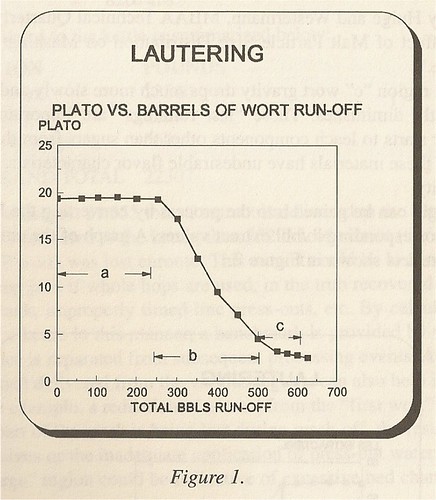 There ya go. It was right under my nose the whole time.
#20
chuck_d
-

- Members
-
- 1022 posts
Frequent Member
- LocationAtlanta, GA
Posted 16 June 2009 - 06:17 PM
What do a, b & c stand for?
0 user(s) are reading this topic
0 members, 0 guests, 0 anonymous users

